How to Use Infographics to Improve Your SEO Strategy
Category: Guide, Search Strategy | Tags:
In search engine optimization (SEO), it’s always a good idea to update older content, especially content that isn’t performing as well as it once was. Along with updating any links or pieces of data, one great way to reoptimize your content is by creating and inserting an infographic.
As a content marketer, the term “infographic” may not be an unfamiliar one. However, the link between SEO and infographics is often overlooked in the digital marketing realm. Here are some of our best tips to create and use infographics for your SEO efforts.
On This Page
What is an Infographic?
An infographic is any sort of visual representation of information. Early infographics visualized specific points of data using unique graphs and charts. However, the term has expanded to include many different types of imagery.
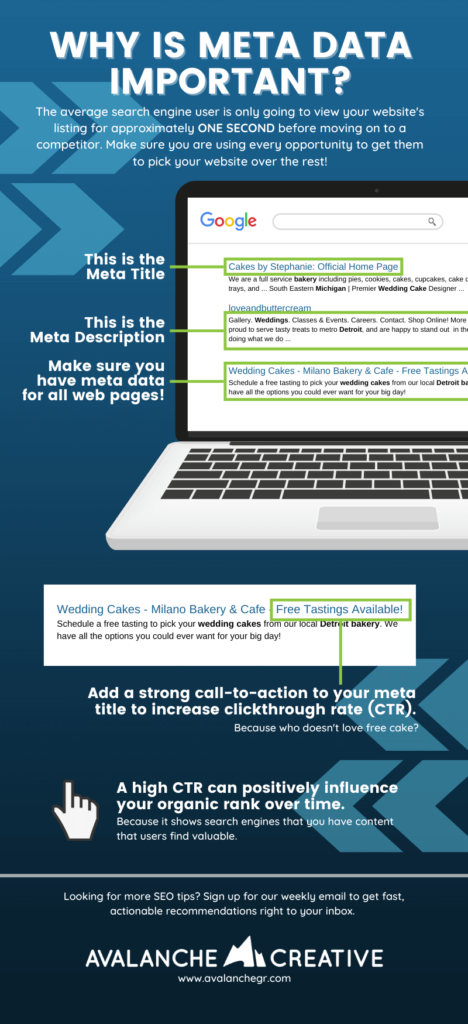
The main goal of an infographic is to convey information in a visual and creative way. Looking for examples? Here is an infographic that we created for our blog post about why meta titles are important.
Are Infographics Good for SEO?
Think of it this way: any changes that you can make to your website content that prioritize and improve the user experience can be good for SEO. Why? Because Google ranks search results based on which website gives the best user experience (in their eyes)—among other factors.
Not only this, but more visuals in your blog posts like infographics make your content more readable and shareable on social media. We know that social shares can help SEO. This is because more traffic to your content can be an indicator to search engines like Google that the content is useful.
Can Google Read Infographics?
Although search engines like Google can’t “read” images, they will find and use contextual information to understand them. Some examples of this information are not only the image’s filename and alt text, but also the web page’s H1 tag, meta description, and URL. Google will crawl the page’s supporting text for information as well.
How Do I Make an Infographic for SEO?
Creating an infographic sounds like a daunting task, but it’s actually very easy to do when you know what type of content you want to present in a visual format. Here at Avalanche, we like to update existing blog posts with infographics to give our older blog posts a nice refresh.
Once you have an idea of the information you want to represent, start sketching some ideas. Start with a clear title that includes your target keyword. Break up separate ideas or thoughts into different sections on your graphic. Add icons or a photo element to keep things visual.
Here are some good design tips for your infographic:
- Stick with only one or two different fonts. Make sure they’re readable and used appropriately.
- Don’t go overboard with your color palette. If you use one or two really vibrant colors, pick another two or three colors that are more muted.
- Take a break from your design. If you’re feeling stuck, walk away from the computer and work on something else to give your eyes a rest. You’ll come back to the design process with a fresh perspective.
- Optimize your infographic for multiple devices. Users on phones, tablets, and computers are more likely to scroll up and down to view more information, so consider making your infographic tall and long rather than short and wide.
All in all, make sure to have your target audience in mind throughout this process. What are the tidbits of information from this piece of content that are most important to convey to answer their questions? After all, you don’t want to create an infographic that is too text-heavy.
Optimizing Your Infographic for SEO
Here are the things to check before you publish your finished infographic:
- Optimize your filename. It’s good practice to include your main keyword in the filename of the infographic, as well as in the title tag of the image.
- Check the image resolution. Make sure your infographic is big enough on the webpage to be clear and readable. Don’t forget to account for higher resolution retina screens!
- Add image alt text. As stated above, search engines like Google can’t read the text on images (yet), so it’s important to add image alt text to describe your infographic. Screen readers use alt text to describe the image to those that are visually impaired, so don’t forget to include it!
- Include your logo and a call-to-action. At the bottom of your infographic, include source information along with your company’s logo. Write a sentence or two about what you do and where customers can go to learn more. This comes more into play in the next section. Need a logo? Use a logo creator.
- Post an embed code. Encourage others to share your infographic by including an embed code below the image. This gives them a quick way to link to your website. Don’t forget to include UTM parameters for any URLs that direct traffic to your website!
How Can I Use Infographics for Link Building in SEO?
Well-planned and useful infographics can help you earn more website traffic by adopting an infographic submission strategy. Infographic submission is when you promote your infographic(s) to targeted websites to earn more traffic and brand recognition from key audiences.
Send your finished infographic, along with an embedded link to the webpage that hosts the image, to relevant websites, blogs, and publications. If you have specific pages or posts on that website that you think the infographic would work well on, even better!
What Are Some Other Ways to Promote My Infographic?
Once your infographic is published, create some different versions and sizes that “tease” the information it conveys and share them on social media. Make sure to include UTM links in your post so you can track the number of viewers that visit your post from the link!
If you know that your target customers go to Pinterest to learn new information, consider creating an account. We have found that posting the full infographic on Pinterest along with a brief description and a tracked link to the blog post has helped us get more impressions and clicks from this specific platform.
To add to the infographic fun, here is an infographic about infographics.
Share this Image On Your Site
Share this article:
The Avalanche Email: Fun. Simple. Educational. No Selling.
Learn Result-focused SEO & Content
Join over 2,272+ others who get one email every Wednesday with simple instructions on how to get more website traffic and leads through SEO and content marketing. (Learn more about the email)


Keep Learning
Volunteering at Kids’ Food Basket – ’26 Retreat
See how the Avalanche Creative team gave back at Kids’ Food Basket, packing burritos for families across West Michigan during our retreat.
Saving the Galaxy at our ‘26 Company Retreat
See how the Avalanche Creative team spent our 2026 company retreat in Holland, MI: a Star Wars themed week of strategy.
Good Content Generates Leads. Here’s How.
How do you generate leads from content marketing? It’s not hard, but it can feel risky. Navigate the Sea of Sameness by leaning on your brand’s expertise, unique perspectives, and personality. AI can build your content ship, but human writing is how people trust the captain.
Stop Publishing Content That Nobody Finds
Content templates help plan the work before a word gets written. Learn why you should use them and how to set them up.
How To Show Up in Gemini (And Win More Local Jobs)
Show up in Gemini when homeowners search for landscaping services. Build the right signals on Google and your website to win more qualified local jobs.
How to Run Google Ads for Landscapers: A Complete Guide
Learn how to set up Google Ads for landscapers, attract qualified leads, and win more local jobs with this step-by-step guide.