
Does More Traffic Equal More Leads for Landscapers?

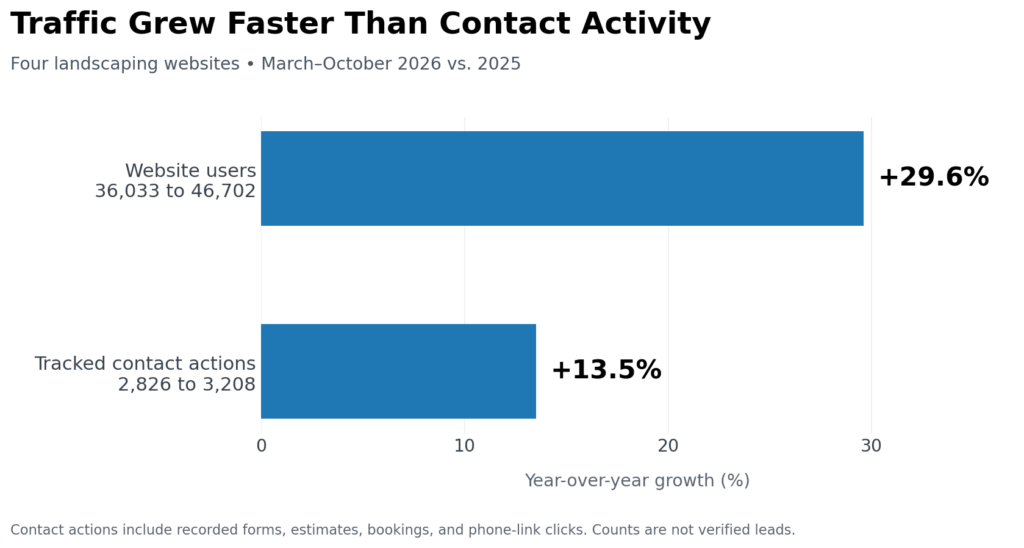
Four landscaping websites brought in nearly 30% more traffic in 2026. They also recorded 382 more contact actions (form fills, emails, or phone calls) than the year before.
Sounds like a good year, right?
Look at the conversion rates, though, and you’d get a different impression. The percentage of visitors taking a tracked contact action fell 12.4%.
For a landscaping company investing in SEO, that’s a confusing report. More people are finding the business, more are reaching out, but a smaller share of visitors are taking the next step. Is something going wrong?
We wanted to find out.
At Avalanche Creative, we manage SEO and websites for landscaping companies across the country. We pulled 34 months of Google Analytics 4 data from four clients in Michigan, Pennsylvania, Virginia, and Washington, then compared it with their website change histories.
Our first theory involved rising gas prices and homeowners pulling back on spending. The timing looked interesting, but we couldn’t establish a reliable connection. What we found inside the websites was far more revealing.
Traffic Was Up. Contact Rates Were Down.
Start with the numbers across all four websites, comparing March through October 2025 with the same months in 2026.
| Metric | 2025 | 2026 | Change |
|---|---|---|---|
| Website users | 36,033 | 46,702 | +29.6% |
| Tracked contact actions | 2,826 | 3,208 | +13.5% |
| Contact actions per 100 users | 7.84 | 6.87 | −12.4% |
Source: Avalanche client GA4 reports. Contact actions include tracked form submissions, estimate requests, appointment bookings, and phone-link clicks. These aren’t verified individual leads.
Traffic grew more than twice as fast as contact activity. That’s worth investigating, particularly when a company’s marketing budget depends on getting the right homeowners to reach out.
But there’s an important distinction between a lower conversion rate and fewer leads. The websites recorded more contact actions, even as the per-visitor rate declined. And when we examined the individual companies, the picture became more interesting.
One Website’s Contact Rate Fell While Inquiries Soared
Consider a landscaping company in West Michigan. Its website attracted 2,242 users between March and October 2025. During the same period in 2026, that number climbed to 8,124.
That’s 262% growth.
Tracked form submissions, online estimate requests, and phone clicks also grew, from 211 to 509. The company recorded 298 additional contact actions compared with the previous year.
Now look at the contact rate.
| Metric | 2025 | 2026 |
|---|---|---|
| Website users | 2,242 | 8,124 |
| Contact actions | 211 | 509 |
| Actions per 100 users | 9.41 | 6.27 |
The rate fell by roughly a third.
If we focused only on that percentage, we might conclude the website was performing worse. Yet the business recorded more than twice as many contact actions.
Neither number tells the whole story.
The company launched a new website in March 2025, so its first season wasn’t necessarily a stable baseline. In February 2026, we also updated its estimate-focused CTAs. And with traffic growing so quickly, the mix of people arriving at the site could have changed.
Some visitors may have been researching landscaping costs. Others could have been ready to request a quote. Without reviewing their traffic sources and behavior, we can’t assume those groups converted at the same rate.
This is why a falling conversion rate deserves investigation rather than an automatic course correction.
What Happened When We Changed The CTAs?
Our Pennsylvania landscaping client gave us a different kind of mystery.
In 2025, we introduced an online pricing experience called Price Guide AI. Visitors could explore project costs rather than going straight to the traditional contact form.
The reasoning made sense. Give homeowners a way to learn about pricing, reduce the friction of reaching out, and make the website more helpful.
By early 2026, however, the traditional contact-form numbers had dropped sharply.
And this wasn’t happening because fewer people were arriving from Google.
Organic Traffic Grew, But Form Submissions Nearly Disappeared
Compare January and February 2025 with the same months in 2026.
| Metric | Jan–Feb 2025 | Jan–Feb 2026 |
|---|---|---|
| Organic website users | 374 | 895 |
| Confirmed contact forms | 30 | 5 |
| Form events per 100 organic users | 8.02 | 0.56 |
Organic traffic increased 139%.
Meanwhile, confirmed contact-form submissions fell 83%. Relative to the number of organic visitors, the traditional form submission rate declined approximately 93%.
We weren’t counting button clicks or how many people opened a form. These events occurred when visitors reached the contact-form thank-you page. So, obviously something had changed in how people interacted with the website.
We Changed Course. Then The Numbers Changed.
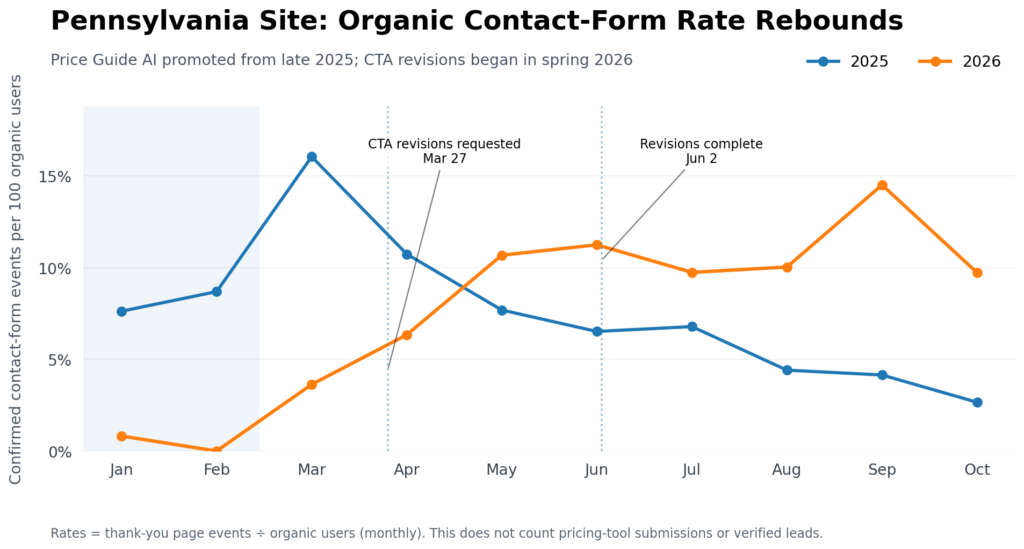
On March 27, 2026, our team opened a task to revise the site’s CTAs after noticing a decline in conversions.
The changes included:
- Redirecting prominent CTAs back to the contact form.
- Removing Price Guide AI from service and service-area pages.
- Moving the homepage CTA higher.
- Simplifying the contact forms.
The revisions were completed by June 2. As work progressed, confirmed contact form submissions began to recover.
By May, the organic form rate had overtaken the previous year’s rate. It stayed above the 2025 level through October.
The July through October comparison was particularly striking: 103 confirmed organic contact-form submissions in 2026 versus 38 in 2025.
That translated to 11.10 form events per 100 organic users, compared with 4.58 a year earlier.
Did Price Guide AI Cause The Decline?
We can’t say that.
During January and February 2026, Price Guide AI recorded 33 Submitted events across all traffic sources. Some visitors who might previously have used the contact form were evidently interacting with the pricing tool instead.
Even if every one of those 33 submissions had come from organic search, adding them to the five traditional form confirmations would produce a maximum of 4.25 recorded submission events per 100 organic users. That’s still below the 8.02 traditional form events per 100 organic users in the prior year.
It’s a useful comparison, but not proof of lost business. We couldn’t verify whether every pricing-tool event represented a unique inquiry, and the calculation doesn’t include calls or other contact methods.
Other factors could have influenced the results, too, including changes in visitors and seasonal demand.
We can document that traditional contact-form activity recovered substantially during and after the CTA revisions.
For landscaping companies considering estimate calculators, pricing tools, or new contact forms, that distinction is important. A feature can look helpful without producing the outcome you expected.
Measure what visitors actually do after you introduce it. And be willing to change course when the results raise questions.
The Phone Wasn’t Going Quiet After All
Our original investigation assumed homeowners might be avoiding phone calls as costs rose, but the combined data didn’t support that theory.
Across all four websites, phone-link clicks increased from 386 in March through October 2025 to 493 during the same months in 2026.
That’s nearly 28% more phone clicks.
Adjusting for increased traffic, phone-click activity was nearly unchanged, at approximately 1.1 clicks per 100 users in both periods.
The companies also behaved differently:
- The West Michigan company’s phone clicks rose from 91 to 117.
- Pennsylvania’s fell from 74 to 48.
- Virginia’s increased from 103 to 191.
- Washington’s rose from 118 to 137.
A phone click doesn’t prove someone completed a call, but these results challenged the idea that landscaping customers across the board had become reluctant to pick up the phone.
Different websites were producing different behaviors. Their contact options, visitor mix, and service focus weren’t identical, either.
We had another problem to investigate before drawing conclusions about the broader market.
One Tracking Issue Nearly Changed The Entire Story
The Washington company’s analytics raised a red flag.
Between March and May 2025, its old contact_us event recorded 311 submissions. The company launched a redesigned website around June, and its primary form tracking shifted to different event names.
The earlier counts looked unusual, but we couldn’t determine whether they represented legitimate submissions, repeat events, automated traffic, or a tracking defect.
So we tested what happened when we removed that inconsistent event type from the analysis in both years.
The results changed dramatically.
| Four-site comparison | Reported change in contact-action rate |
|---|---|
| Including all tracked events | −12.4% |
| Excluding the inconsistent contact_us event | −3.4% |
The apparent decline became much smaller.
That doesn’t mean those events were invalid, or that 3.4% is the corrected result. It’s a test showing how heavily the original conclusion depended on one event type.
Imagine making a marketing decision based on the first number without knowing that history.
You might rebuild a contact page, change your advertising budget, or blame the economy when part of the apparent decline came from how website activity was recorded.
Before interpreting a conversion trend, check whether you’re still measuring the same thing.
What Should Landscaping Companies Actually Measure?
After reviewing four websites, multiple redesigns, CTA changes, and several years of analytics, we didn’t find a single conversion-rate benchmark that tells every landscaping company whether its marketing is working.
We found better questions to ask.
- Are more people contacting you? Look at the total number of completed forms, estimate requests, and phone interactions alongside website traffic. A lower conversion rate can still accompany substantial growth in contact activity.
- Where are those visitors coming from? Separate organic search, paid advertising, referrals, and other channels. People researching landscaping ideas may behave differently from homeowners looking for a contractor today.
- What happens when someone clicks a CTA? Follow the path. Does the visitor reach a simple form, an estimate tool, a calendar, or another page? Does that path lead to a completed inquiry?
- Has your tracking changed? Website launches, new forms, and GA4 updates can alter what gets counted. Keep a record of those changes so you can interpret performance over time.
- Which inquiries turn into qualified leads? When sales information is available, connect website activity with estimates, conversations, and booked projects. Those outcomes help show whether increased website activity is creating business opportunities.
None of this means conversion rates are useless. They’re valuable when paired with context, stable measurement, and a clear understanding of what the website is designed to accomplish.
A single number should start the investigation, not end it.
More Traffic Is A Start. Find Out What Happens Next.
We began this research looking for evidence that gas prices were affecting landscaping leads. Instead, we uncovered something closer to home.
Website changes can influence how people contact a landscaping business. New traffic may behave differently from established visitors. And tracking changes can make ordinary performance look like a sudden problem.
Had we stopped at the original conversion-rate decline, we would have missed the growth happening underneath it.
That’s the work behind landscaping SEO at Avalanche. We help companies attract people searching for their services, then study what happens once those visitors reach the website. The goal is qualified leads, not a prettier traffic report.
Curious what your website numbers are telling you?
Request a free website audit. We’ll look for opportunities to turn more of your search visibility into business.
About The Data
Avalanche analyzed monthly Google Analytics 4 exports for four landscaping businesses in Michigan, Pennsylvania, Virginia, and Washington. The primary comparison covers March through October 2025 and the same months in 2026, using the available records within a January 2024 through October 2026 reporting window.
Tracked contact actions include recorded form submissions, estimate tool submissions, appointment bookings, and phone link clicks. These are event counts, not verified unique leads or completed sales. The contact-action rates divide summed monthly events by summed monthly website-user counts; a returning visitor may be counted in more than one month.
The Pennsylvania analysis uses organic search visitor counts and contact form thank-you page events. Price Guide AI submissions were available only across all traffic sources.
Website change histories came from Avalanche project records, PagePulse monitoring, SEO annotations, and GA4 event histories. Several sites launched new websites or changed tracking during the comparison period. We evaluated those differences when interpreting results.
The findings show recorded patterns and associations. They do not establish that any single CTA change, website update, or economic condition caused the observed results.